Lake Superior, the largest of the Great Lakes, is a major water source for humans as well as a habitat for a large amount of wildlife who depend on plants, plankton, fish, and other food sources found in the lake. The shoreline is vulnerable to pollutants found in runoff from surrounding areas, so understanding how water circulation affects the distribution of these pollutants is important. Also, due to warmer winters in recent years, there has been less ice cover on the lake, resulting in warmer water and a possible change in the makeup of the organisms living there.
In order to better understand how these changes might affect the lake, MSI PI Katsumi Matsumoto (professor, Earth Sciences), his PhD student Paul McKinney (now at US EPA in Duluth, Minnesota), and staff member Kathy Tokos (Earth Sciences) studied horizontal water mixing over a ten-year period using a three-dimensional numerical model and virtual tracers. The nature of water circulation in the lake varies seasonally, since water density is related to its temperature. Other factors affecting water mixing are coastal upwelling and downwelling, eddies, and instabilities associated with thermal fronts. The authors used the Regional Ocean Modeling System (ROMS), configured for Lake Superior, and ran it on MSI’s supercomputers. The paper describing this research was published in February 2018 in the journal PLoS One: Paul McKinney, Kathy S. Tokos, Katsumi Matsumoto. 2018. Modeling nearshore-offshore exchange in Lake Superior. PLoS One 13 (2). doi: 10.1371/journal.pone.0193183.
Besides modeling Lake Superior, Professor Matsumoto’s group also uses MSI for other projects, including:
- Biogeochemical modeling of the global oceans to investigate the response of the marine ecosystem and dissolved organic carbon to global warming
- Biogeochemical modeling of the global oceans using a model developed at MSI, MESMO2, focusing on the variation in the elemental stoichometry biological organisms in the ocean, and the resulting effect on their evolution, distribution, and climatic changes
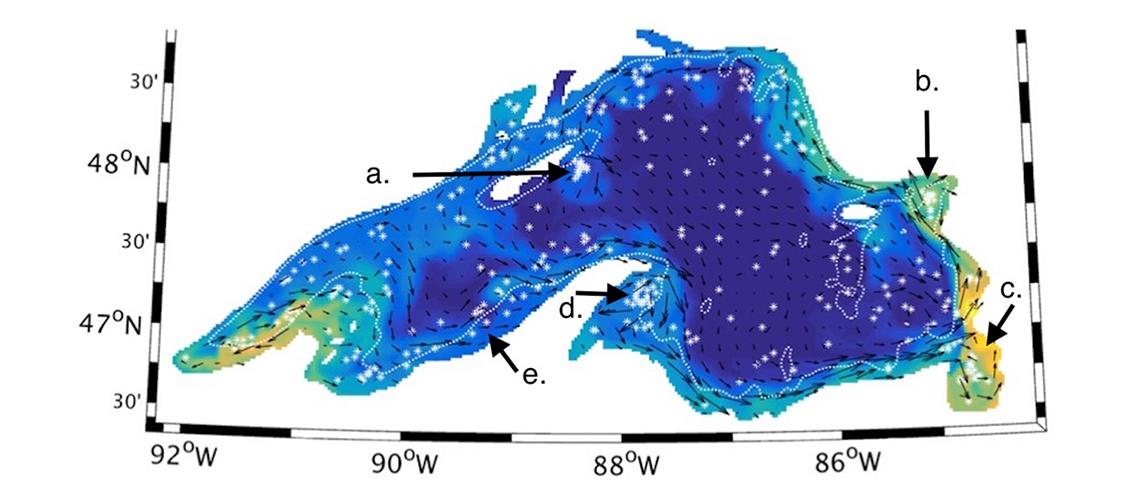
Image description: Late summer season dispersal of passive tracers. Shading indicates surface concentration of passive tracers released on July 1, after 60 days. Vectors show the average direction of currents over the preceding 30 days. White stars indicate eddy locations over the previous 30 days. Arrows a-e indicate areas where eddies were detected in the SAR study discussed in the text. The white dotted line indicates the location of the 100 m depth contour. Image and description, McKinney P et al. PLoS One 13 (2), doi: 10.1371/journal.pone.0193183 (2018).
posted on May 13, 2018