Current astrophysical research indicates that most of the mass of the Universe is made up of a substance called “dark matter,” so called because it cannot be seen. Its presence is inferred by its gravitational effects. Astrophysicists believe that the gravitational pull of dark matter causes galaxies to hold together and also to form into giant clusters. Little is known about this enigmatic material and a great deal of research is ongoing.
MSI PI Liliya Williams, a professor at the Minnesota Institute for Astrophysics (College of Science and Engineering), was part of a team that discovered indications that dark matter may not only be acted upon by gravity. The team was led by researchers at Durham University in the UK. They studied the galaxy cluster Abell 3827, which is interesting because it contains the remnant stellar nuclei of four bright elliptical galaxies. It also has a strong gravitational lens system that allows the distribution of dark matter to be mapped.
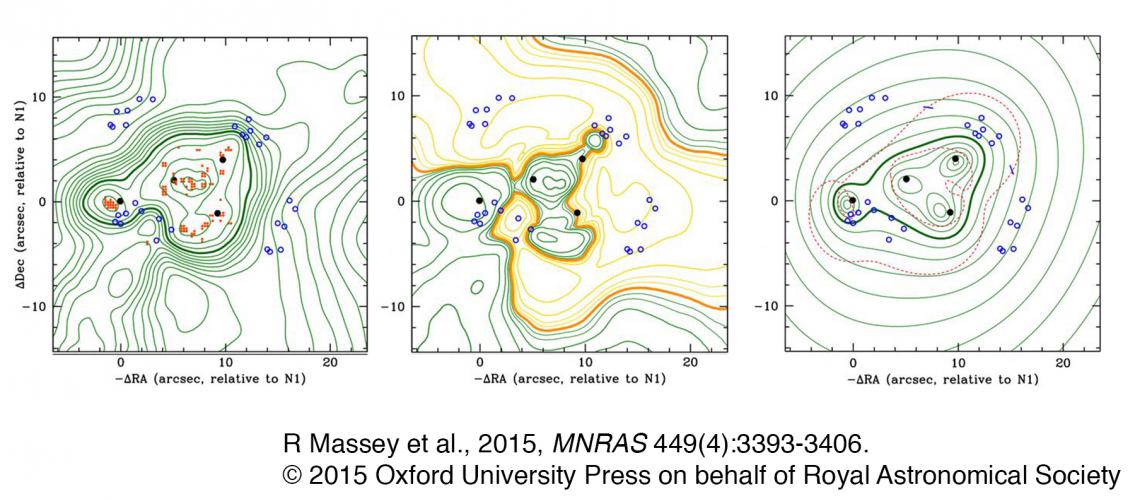
Using Hubble Space Telescope imaging and Very Large Telescope/Multi-Unit Spectroscopic Explorer integral field spectroscopy were used to create the map of dark matter surrounding the four stellar nuclei. One of the two software programs used to create the model of the dark matter is GRALE, which Professor Williams ran on MSI’s supercomputers. (Results from the computer modeling, both in GRALE and LENSTOOL, are shown in the image above.) For one of the stellar nuclei, the mass distribution of the dark matter is offset, which is possible if the dark matter is interacting with a force other than gravity. This is an exciting finding and an area for future research.
The paper was published in April in the journal Monthly Notices of the Royal Astronomical Society: R Massey, L Williams, R Smit, M Swinbank, TD Kitching, et al. 2015 The behaviour of dark matter associated with four bright cluster galaxies in the 10 kpc core of Abell 3827. Monthly Notices of the Royal Astronomical Society 449(4):3393-3406. 10.1093/mnras/stv467.
The article received a great deal of media attention when it was published. A sample of articles that include quotations from Professor Williams are linked below:
- The Daily Galaxy
- Physics Today
- phys.org
- Astronomy magazine
- Discovery News
- Tech Times
- The Telegraph
- The Christian Science Monitor
- Express
Image description: Left panel: map of total mass in the cluster core, reconstructed using GRALE. Green contours show the projected mass density, spaced logarithmically by a factor of 1.15; the thick contour shows convergence κ = 1 for zcℓ = 0.099 and zA = 1.24 (Σcrit = 1.03 g cm−2). Red dots show local maxima in individual realizations of the mass map. Black dots show cluster ellipticals N.1–N.4. Blue circles show the lensed images. Middle panel: mass after subtracting a smooth cluster-scale halo to highlight substructure. The thick contour is at Δκ = 0. The green (positive) and yellow (negative) contours are at Δκ = ±0.025, ±0.05, ±0.1, ±0.2,.... Right panel: total mass, as in the top panel but reconstructed via LENSTOOL. The red dashes show the zA = 1.24 critical curve.
Image and description adapted from R Massey et al., MNRAS 2015;449:3393-3406 © 2015 the authors published by Oxford University Press on behalf of the Royal Astronomical Society.
published on July 27, 2015