In the course of the history of agriculture, humans have tried to change the properties of the crops they raise. Maize (corn) is a very valuable and widely grown crop, and researchers are able to trace how modern maize has been developed from its wild ancestor, a plant called teosinte (Zea mays ssp. parviglumis).
Three MSI Principal Investigators – Assistant Professor Chad Myers (Computer Science and Engineering), Associate Professor Peter Tiffin (Plant Biology), and Professor Nathan Springer (Plant Biology) - were co-authors on a paper published last year in the Proceedings of the National Academy of Sciences (“Reshaping of the Maize Transcriptome by Domestication,” R Swanson-Wagner, R Briskine, R Schaefer, MH Hufford, J Ross-Ibarra, C Myers, P Tiffin, NM Springer, PNAS, 109(29):11878, DOI: 10.1073/pnas.1201961109 (2012)), that reveals changes in the maize transcriptome after it was domesticated. The transcriptome is the set of all RNA molecules in a set of cells. For this paper, the researchers used expression profiling to determine that over 600 genes have altered expression levels in maize compared with teosinte. They studied over 18,000 genes for 38 maize genotypes and 24 teosinte genotypes. The domestication process from teosinte to modern maize is a model for studying how complex traits in plants can be changed over time. The researchers used software and user support available at MSI to help with the data analysis.
Professor Myers uses MSI resources to analyze large-scale genetic interaction networks. Professor Tiffin is involved in several projects related to the evolutionary history of species and connecting genotype (genetic makeup) to phenotype (composite of observable traits or characteristics). Professor Springer uses MSI to study epigenetic variation in maize. (Epigenetics is the study of heritable variation that is not solely attributable to genetic changes.)
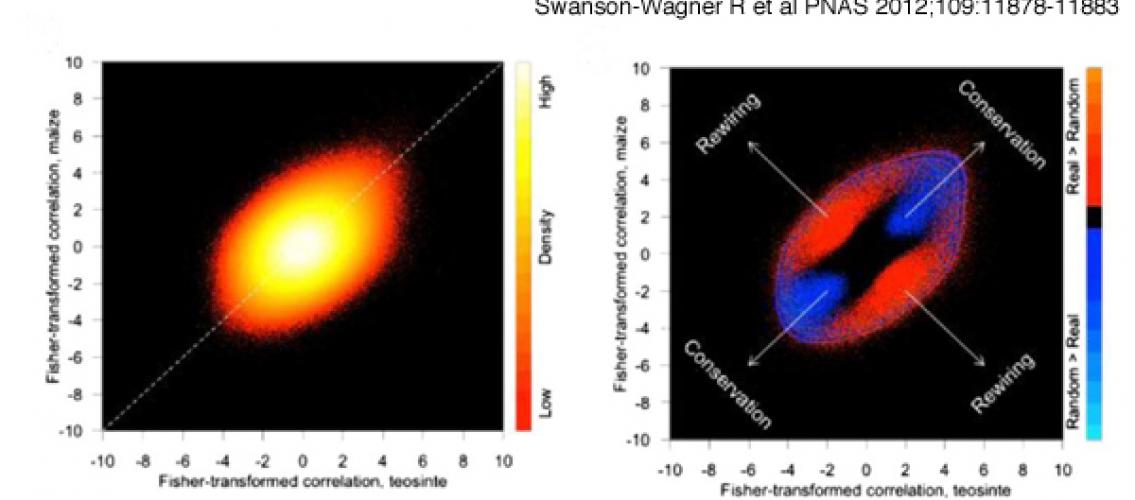
Image Description: The scatterplot in the left image shows the correlation between all gene pairs in maize (x axis) relative to the correlation for the same gene pair in teosinte (y axis). The relative density of data points in the left image was compared with the average for 1,000 bootstrap coexpression networks in the image at right. Blue regions indicate fewer observed correlations relative to the bootstrap networks, whereas red coloration indicates an excess of actual observations, providing evidence for an enrichment of gene pairs with varying correlations in maize and teosinte. Image and description © 2012 by National Academy of Sciences.
Posted on August 28, 2013.